.mat文件存数据
数学建模模型算法速成 1-6-2 01:21
1 matlab基本入门、矩阵及运算规则
1.1 一些指令
clear
清空工作区
clc
清空命令行
iskeyword
获取关键字
disp
显示文本/数值到命令行窗口
1.2 tips
- 有分号就在命令行不输出运行结果
- 没有分号就在命令行输出
1.3 数据类型
- 整数 浮点数
- 字符 字符串
- 矩阵:[]
1.4 矩阵基础
矩阵的创建
- 直接输入法
a = [1,2 3;4 5 6];
A = [1 2 3 4;2:5;3:6];
% ddfsd
- 函数创建法
zeros全为0的矩阵ones全为1的矩阵eye单位矩阵rand均匀分布的随机数randi均匀分布的随机整数randn标准正态分布的随机数
b = zeros(100); %100行100列
c = zeros(100,99); %100行99列
% rand(n),rand(m,n)
d = rand(5,6);
% randi([imin,imax],m,n),randi([imin,imax],n)
e = randi([1,6],20);
% randn(n),% randn(m,n)
f = randn(5,6);
- 导入本地文件中的数据
- txt、.dat或.csv(适用于带分隔符的文本文件)
- xls、.xlsb、.xlsm、.xlsx、.xltm、.xltx或.ods(适用于电子表格文件)
矩阵元素的修改删除
修改
- 直接改几行几列,如果修改范围越界,则用0填充扩大矩阵尺寸
A = [1 2 3 4;2:5;3:6];
A(2,:) = 10; % 第2行全部变成10
A([1,3],[1,4]) = 0; % 第1、3行的1、4列变成0
A([1,3],[1:4]) = 3; % 第1、3行的1至4列变成3
A(5,6) = 888; % 扩大矩阵尺寸
- 线性索引(所有的数从左上角到右下角一列一列的一次标id,即1行1列为1,3行1列为3,1行2列为4)
A(4) = 0;
A([1:4]) = 3;
删除
- 普通删除:只能删除一整列或一整行,否则会报错
A(:,[1,end]) = []; % 删除第一列和最后一列
- 线性索引删除:可以删除任意位置的元素,但矩阵剩下的元素按照线性索引的顺序放到一个向量中,可以使用
reshape重新变回矩阵
A([1]) = [];
A([1:4]) = [];
矩阵的拼接重构重排
拼接
- 横向拼接:A和B的行数相同,那么使用 [A, B]、[A B] 以及 cat(2,A,B) 都能将 A和 B横向拼接成一个大的矩阵。
- 纵向拼接:A和B的列数相同,那么使用 [A; B] 以及 cat(1,A,B) 都能将 A 和 B 纵向拼接成一个大的矩阵。
重构
reshape:更改矩阵形状,reshape(A,m,n)或reshape(A,m,[])(列数由matlab自动补充) 或reshape(A,[m,n])
A = randi(10,2,6)
B = reshape(A,3,[])
重排
sort:对向量或者矩阵进行排序,sort(A,dim),在最后加一个参数'descend'就能变成降序排列dim= 1时,对矩阵每一列升序排序dim= 2时,对矩阵每一行升序排序
sortrows:基于矩阵的某一列对矩阵进行排序,同一行的元素不会改变(整行一起交换顺序)。sortrows(A,列),在最后面加一个输入参数'descend',变成从大到小的降序排列
矩阵的运算
调用函数运算
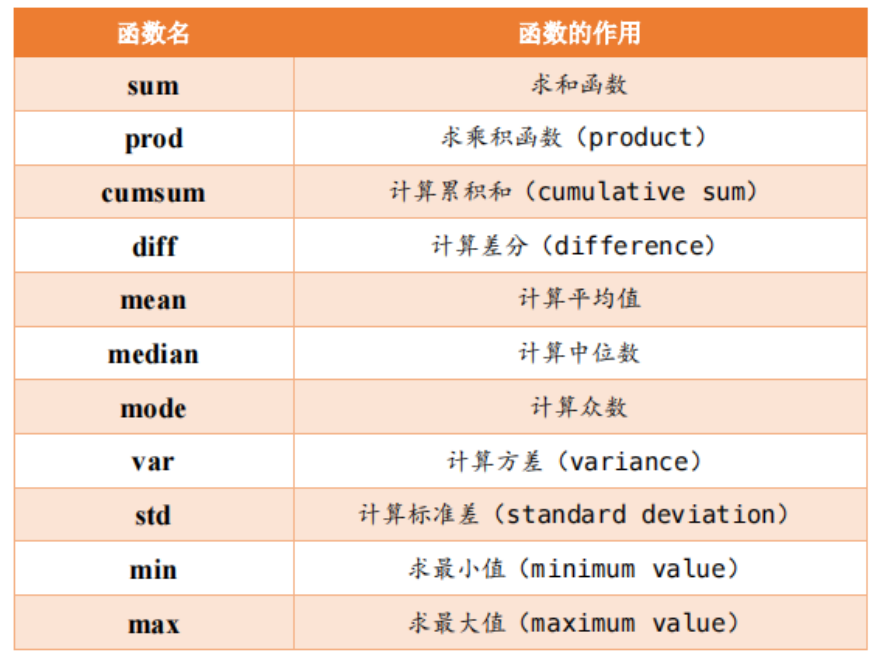
算术运算
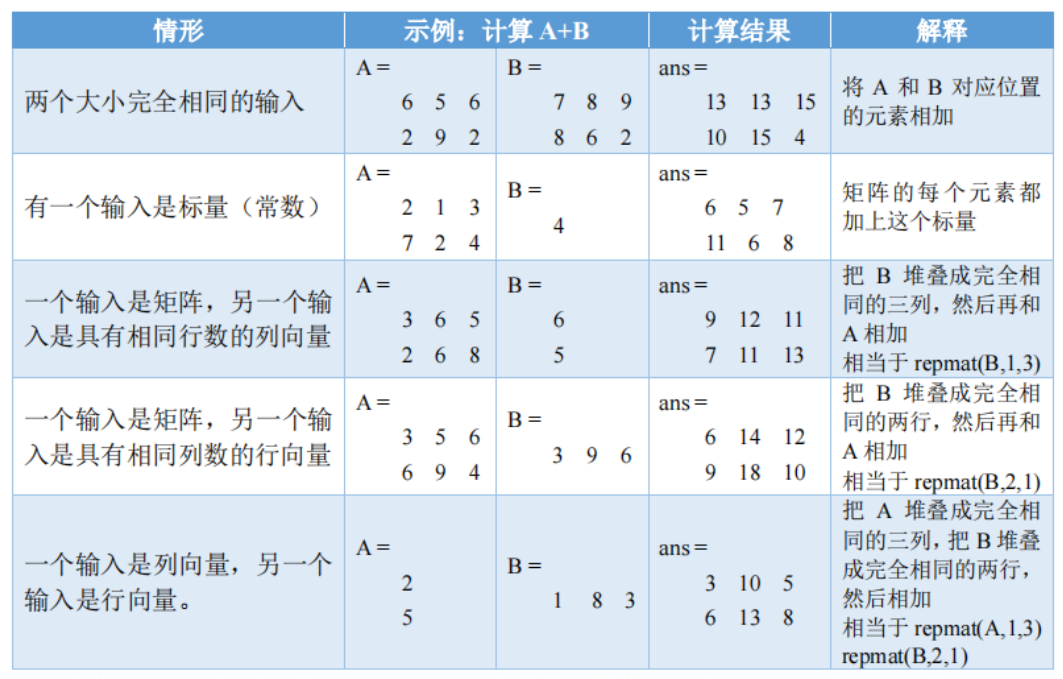
- 加减,有五种兼容模式
- 乘除
- 乘法:A*B(需要A的列数 = B的行数)
- 点乘:A.*B(需要A和B的大小符合五种兼容模式)
- 左除:A\B
- 右除:A/B
- 点除:A./B(需要A和B的大小符合五种兼容模式)
- 乘方:A^3(需要A是方阵,相当于A*A*A)
- 点乘方:A.^B(需要A和B的大小符合五种兼容模式)
- 矩阵转置
- ':转置时,复数会变成共轭复数
- .'转置时,复数不变
关系运算
A和B符合五种兼容模式,比较每个位置的元素
不等于是 ~=
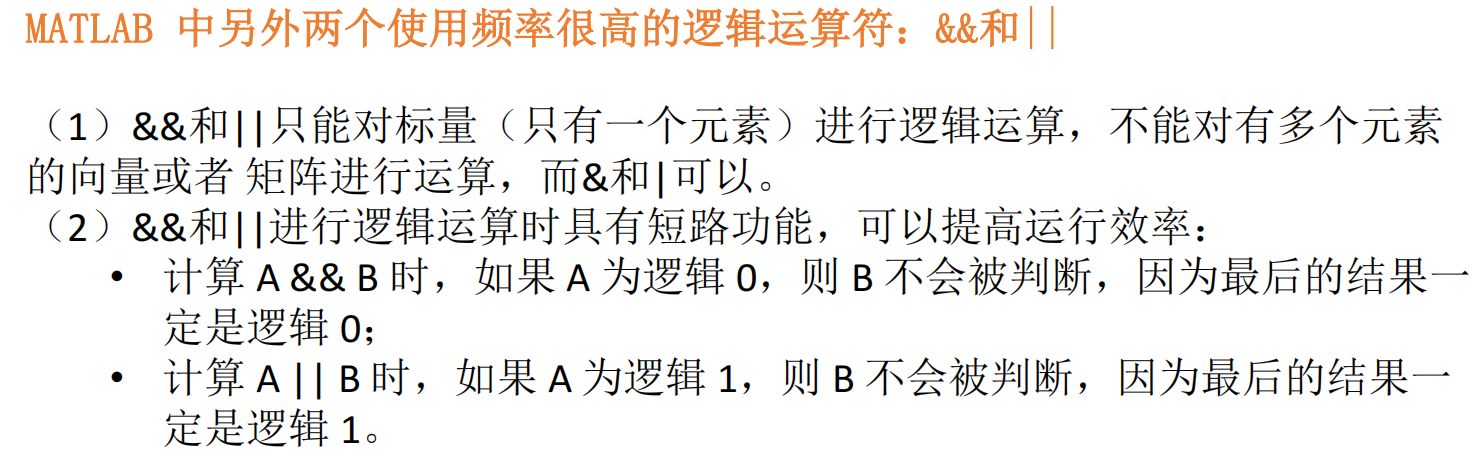
2 matlab逻辑规则、结构基础及函数
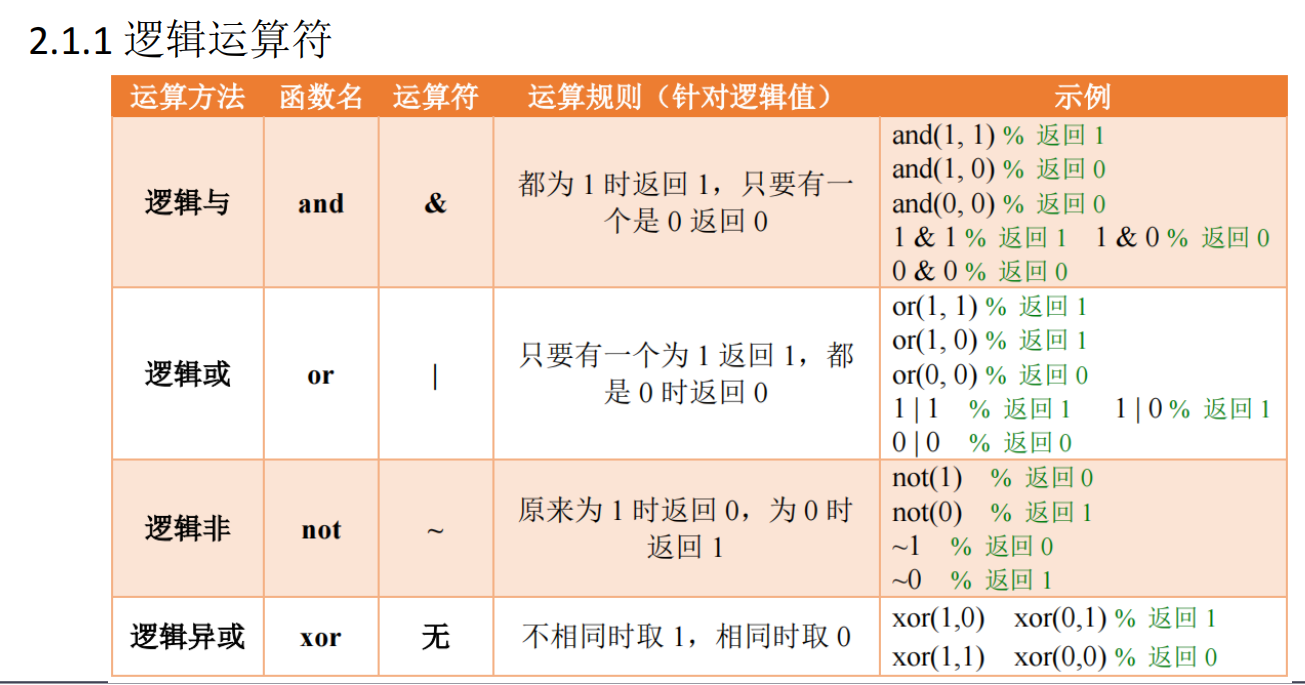
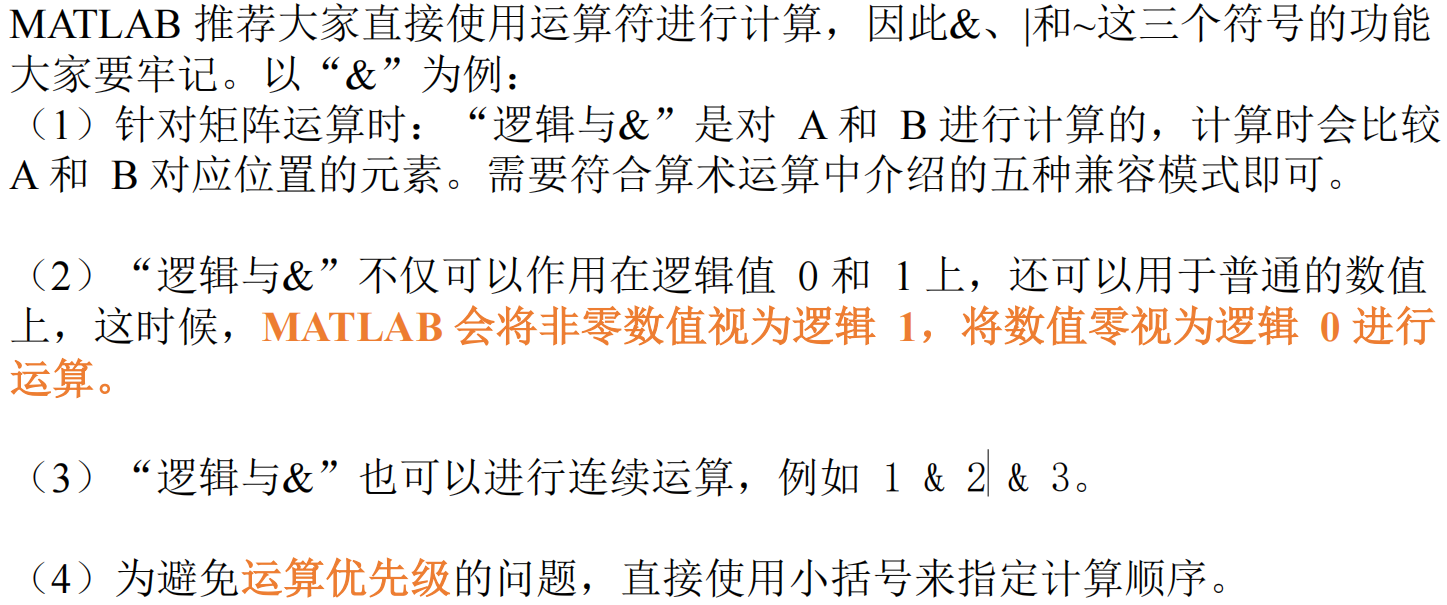
2.1 逻辑基础
特别的, xor(3,4) = 0 (xor(3,4) = xor(1,1) = 0)
A = randi([-3,3],2,4);
B = randi([-3,3],1,4);
A & B;
A | B;
~A;
xor(A,B);
% C = randi([-3,3],1,4)
% D = A & B
% D & C
% A & B & C
% (3>4)&(2>-1)
% A = randi([0,100],1,20)
% res = (60<=A) & (A<80)
% res2 = ~res
% res3 = (A<60) | (A>=80)
clear;
clc;
% B = randi([0,100],2,5)
% B(6) = 0;
% B
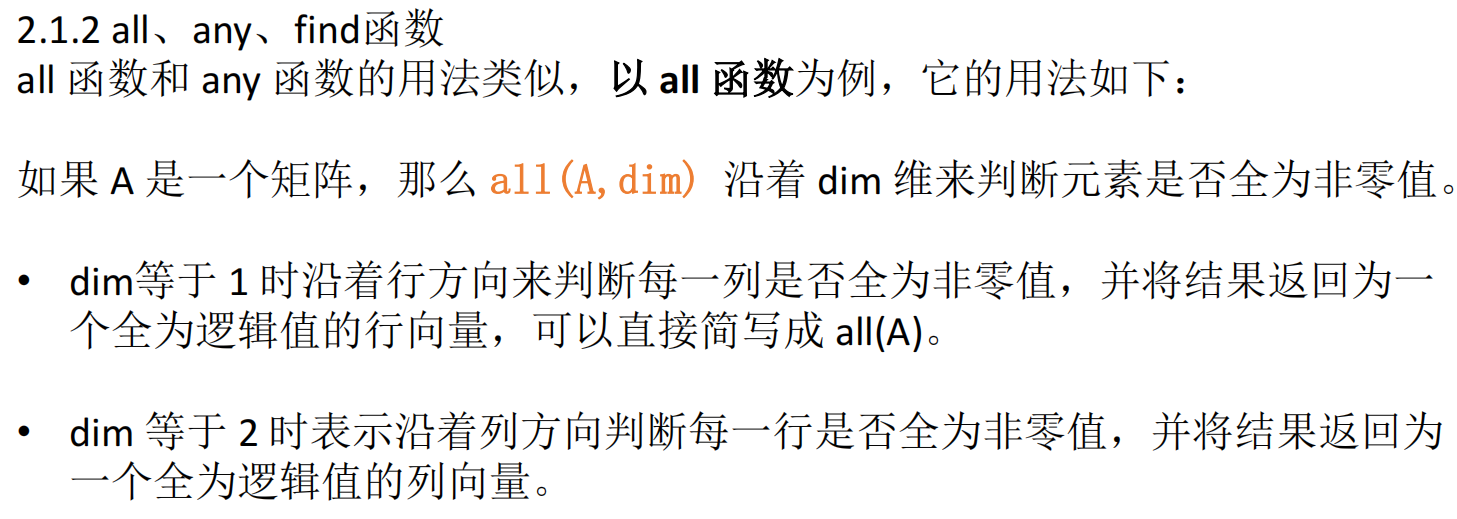
% any(B,1)
% any(B,2)
score = randi([50,100],5,3)
% any(score < 60,2);
% all(score >= 60,1)
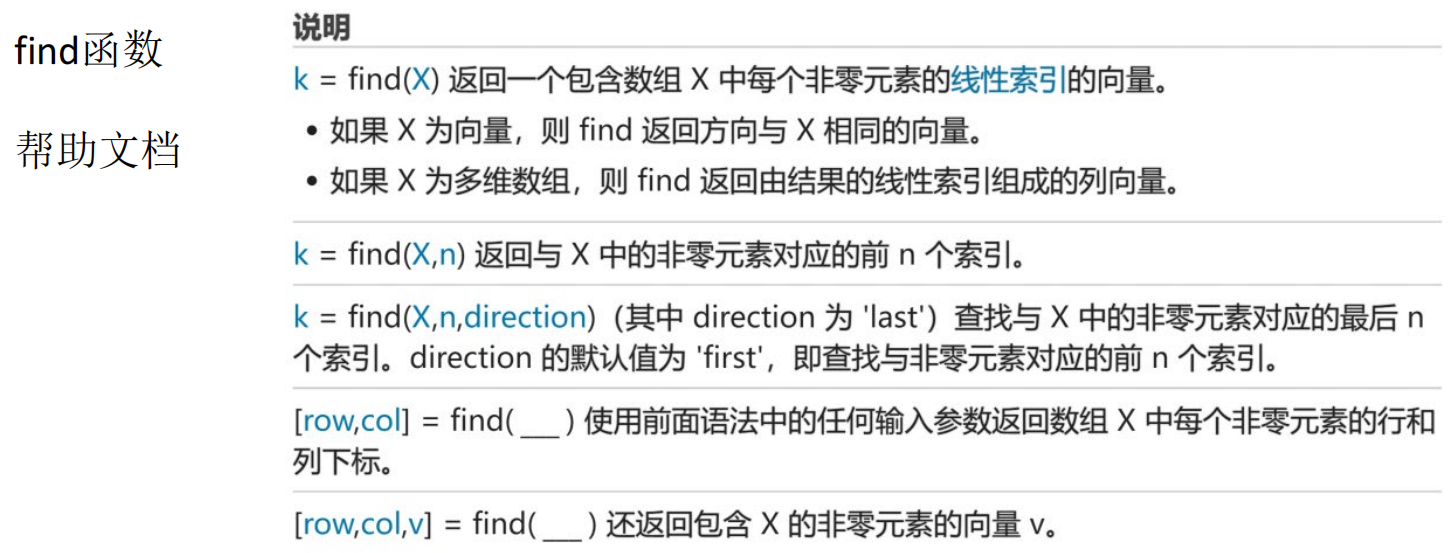
find(sum(score < 60,2)==1);
find(sum(score,2) > 260)
% A = randi([0,2],2,3)
% ind = find(A,2,'last')
% [row,col] = find(A)
% [row,col,v] = find(A)
2.2 结构基础
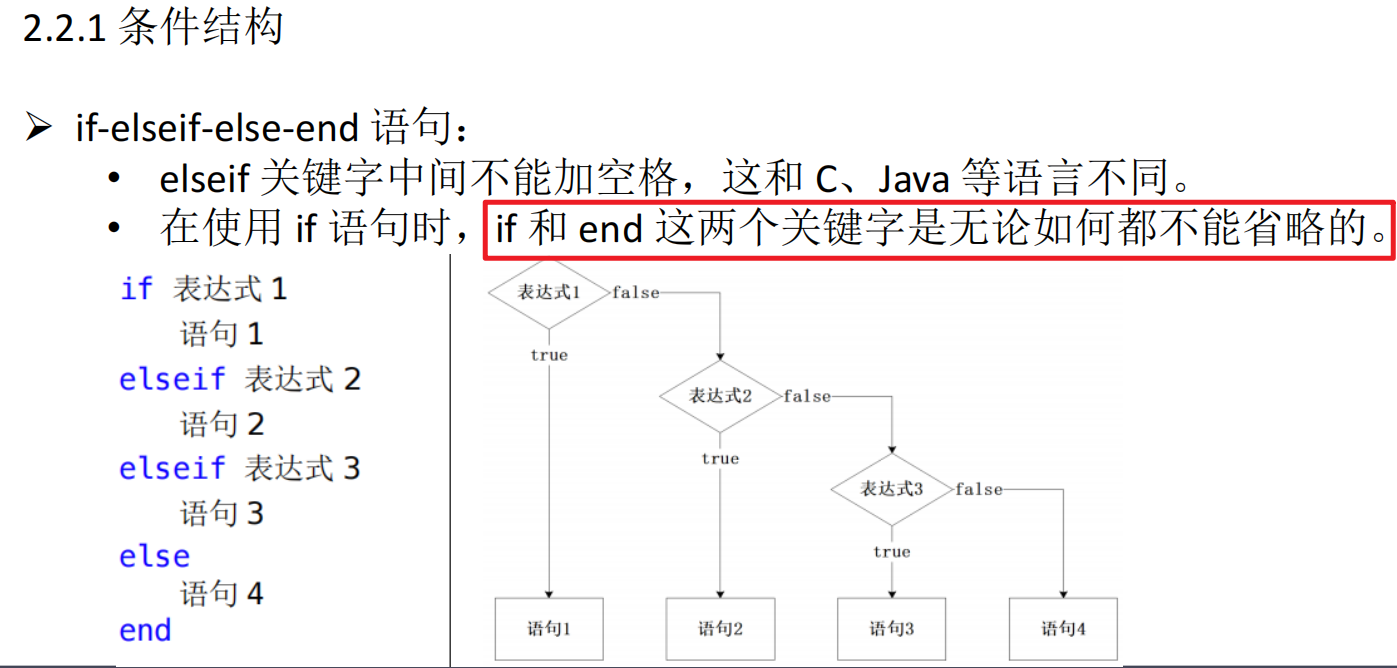
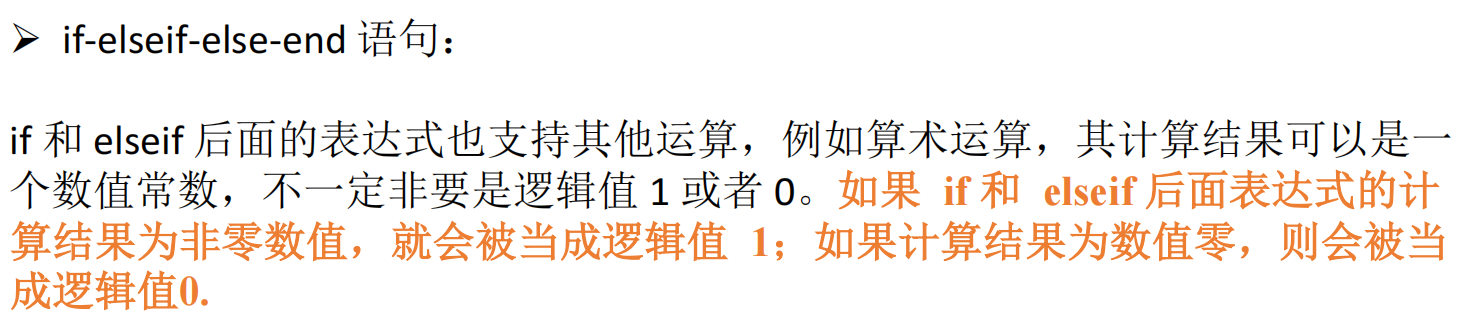
特别的,如果判断语句中是一个矩阵,当且仅当矩阵中元素全部不为0时,判断语句才为1;换句话说,矩阵中有一个元素为0,则判断语句为0
score = 97;
if (score >=90) && (score <= 100)
	res = 1;
elseif (score >=80) && (score < 90)
	res = 2;
elseif (score >=60 && (score < 80))
	res = 3;
elseif (score >=0 && (score < 60))
	res = 4;
else
	res = 0;
end
	res;
A = [1,2;1,3];
if any(A(:))
	res = 0;
else
	res = 10;
end
a = 10;
b = 20;
c = 15;
if a > b
	if a > c
		max = a;
	else
		max = c;
	end
else
	if b > c
		max = b;
	else
		max = c;
	end
end
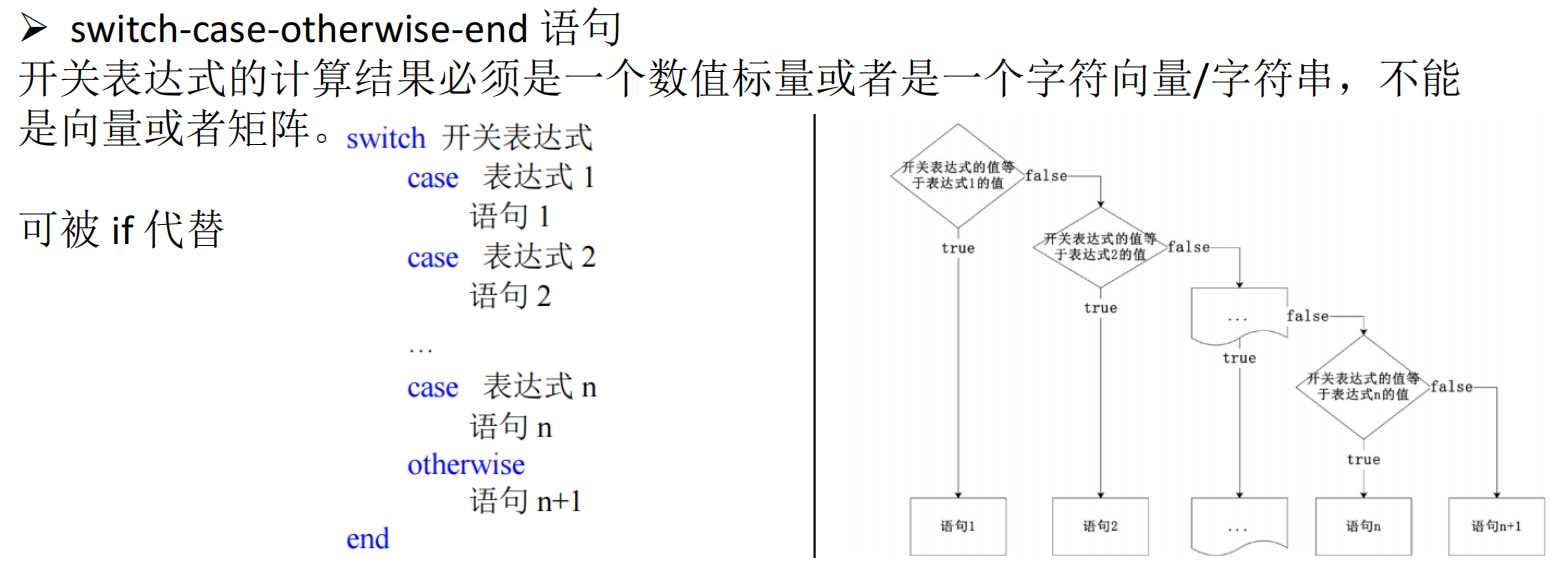
season = randi([1,4])
switch season
	case 1
		disp("春季")
	case 2
		disp("夏季")
	case 3
		disp("秋季")
	otherwise
		disp("冬季")
end
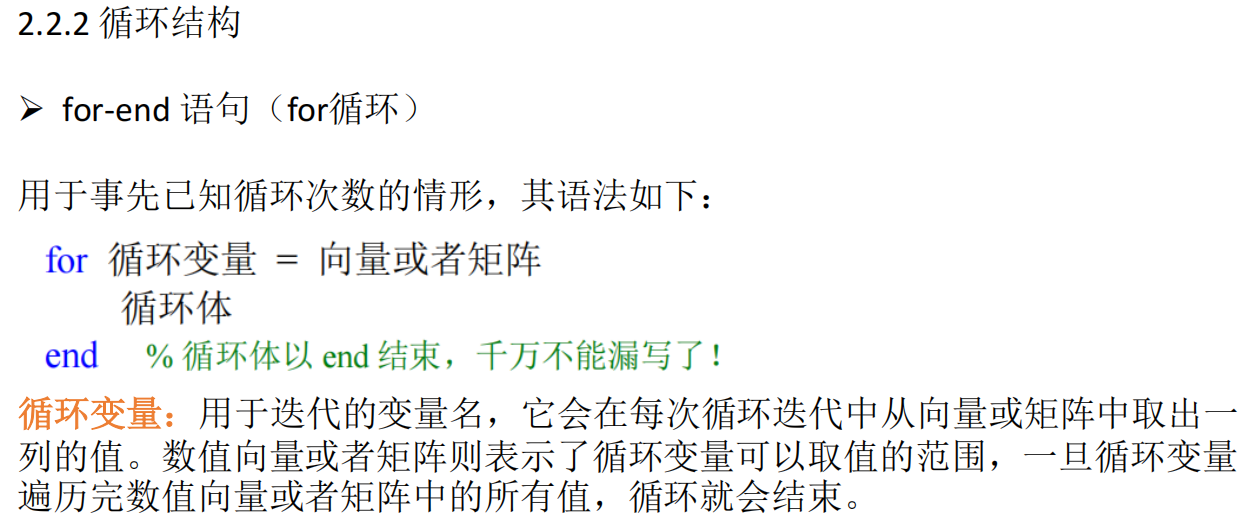
A = randi([-3,3],2,3)
for i = A
	i
end
x = 1:6;
res_sum = 0;
for i = x
	res_sum = res_sum + i;
end
res_sum
leap_year_num = 0;
for i = 1:9999
	if ((mod(i,4)==0) && (mod(i,100) ~= 0)) || (mod(i,400)==0)
		leap_year_num = leap_year_num + 1;
	end
end
leap_year_num
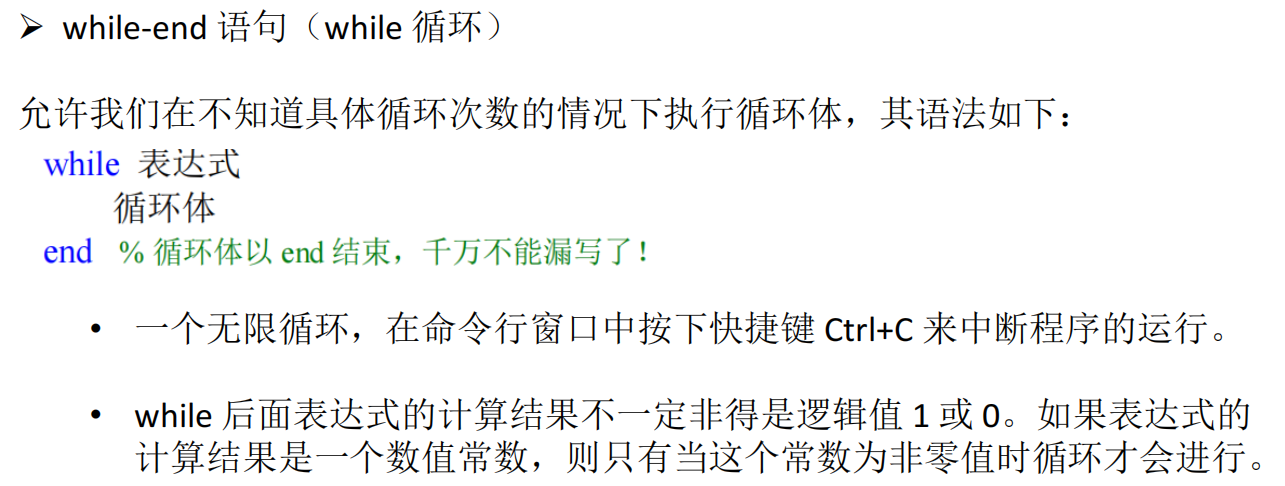
f(1) = 1;
f(2) = 1;
n = 2;
while f(n) <= 99999
	n = n + 1;
	f(n) = f(n-1) + f(n-2);
end
n
f(n)
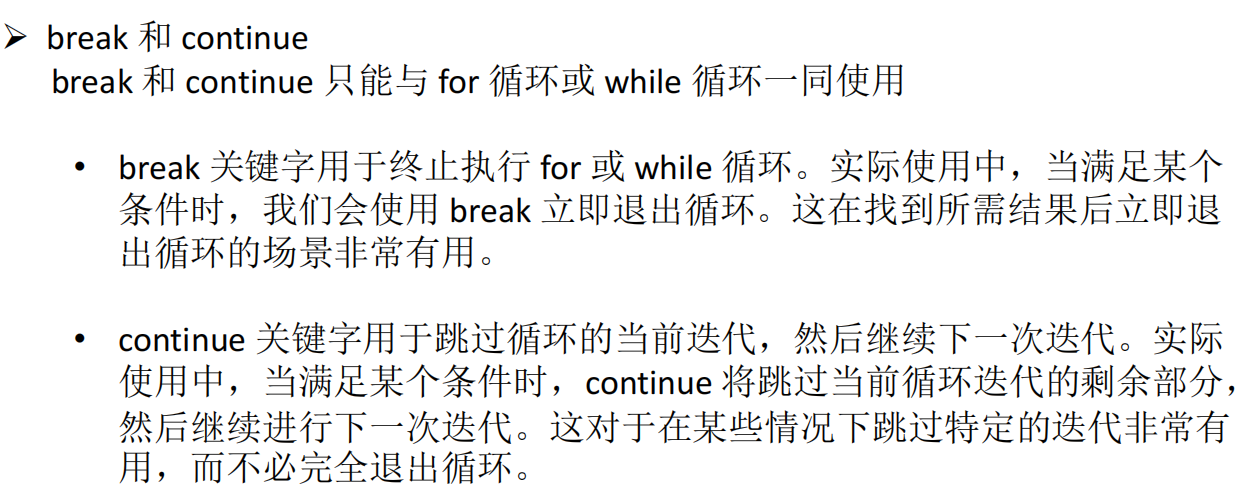
for i=1:10
	if mod(i,2) == 0
		continue;
	end
	i
end
n = 9;
is_prime = 1;
for i = 2:n-1
	if(mod(n,i)==0)
		is_prime = 0;
	break;
	end
end
is_prime
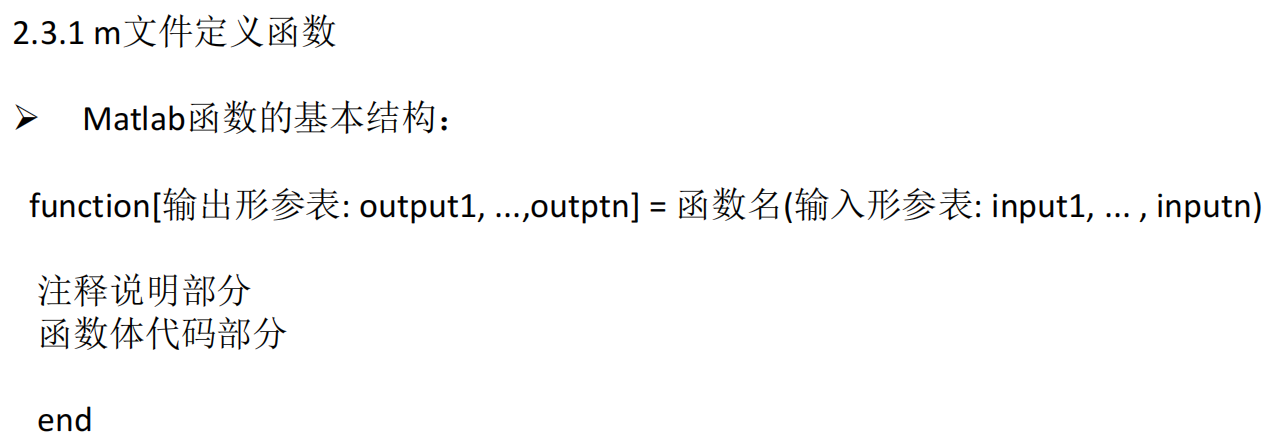
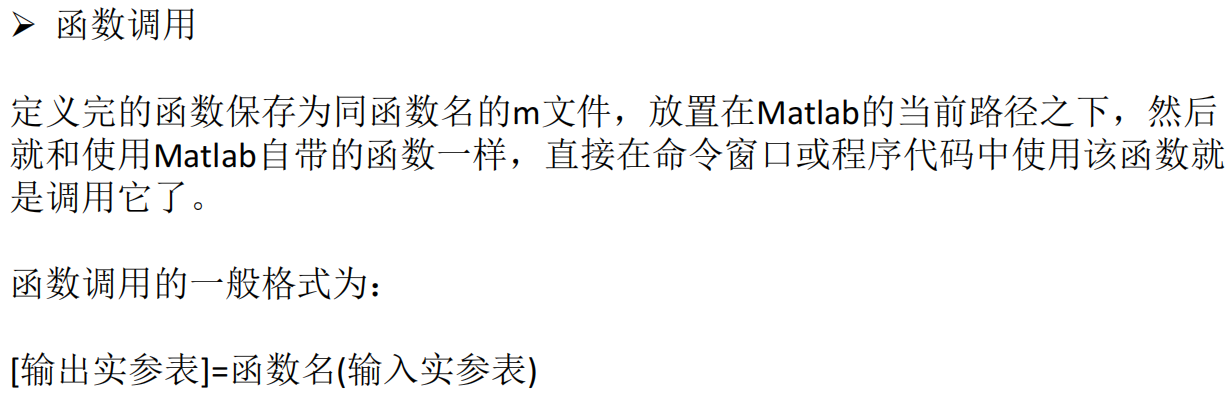
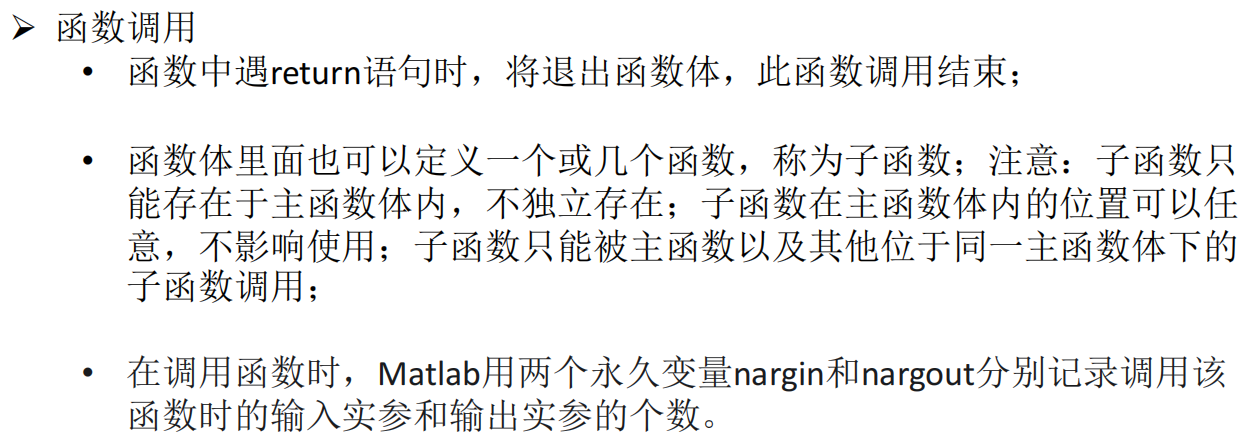
2.3 自定义函数

X = 1:20;
[max,min] = max_min_values(X);
max
min
function [max,min] = max_min_values(X)
	max = subfuc1(X);
	min = subfuc2(X);
	function r = subfuc1(X)
		x1 = sort(X,'descend');
		r = x1(1);
	end
	function r = subfuc2(X)
		x1 = sort(X);
		r = x1(1);
	end
end
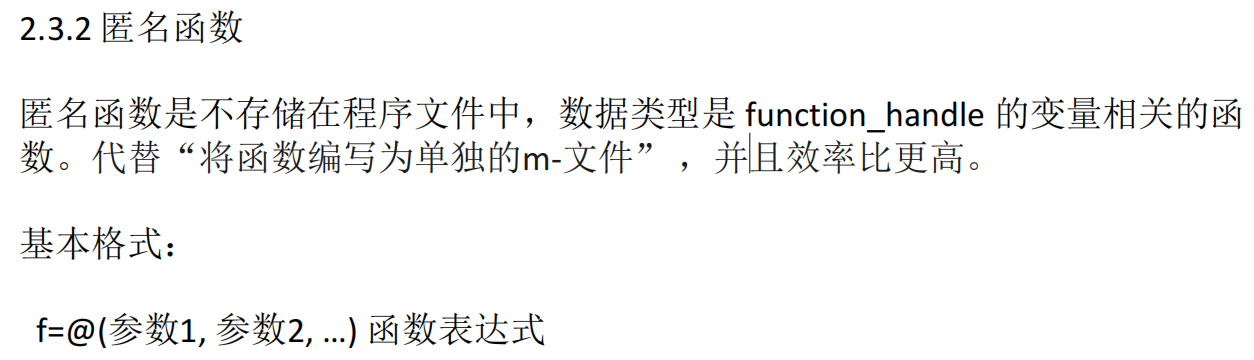
f = @(x,y)x.^2+y.^2;
f(2,3)
x = 1:5;
y = 0.1:0.1:0.5;
f(x,y)
f1 = @(a,b)@(x) a*x+b;
f1(2,3)

f = @(a) @(x)exp(x)+x^a+x^(sqrt(x))-100;
fzero(f(1),4) % a=1时的零点;4是预估值
A = 0:0.1:2; % A=[0.0.1,0.2,...,2]
X = @(A) arrayfun(@(a) fzero(f(a),4),A); % X(A)
Y = X(A)
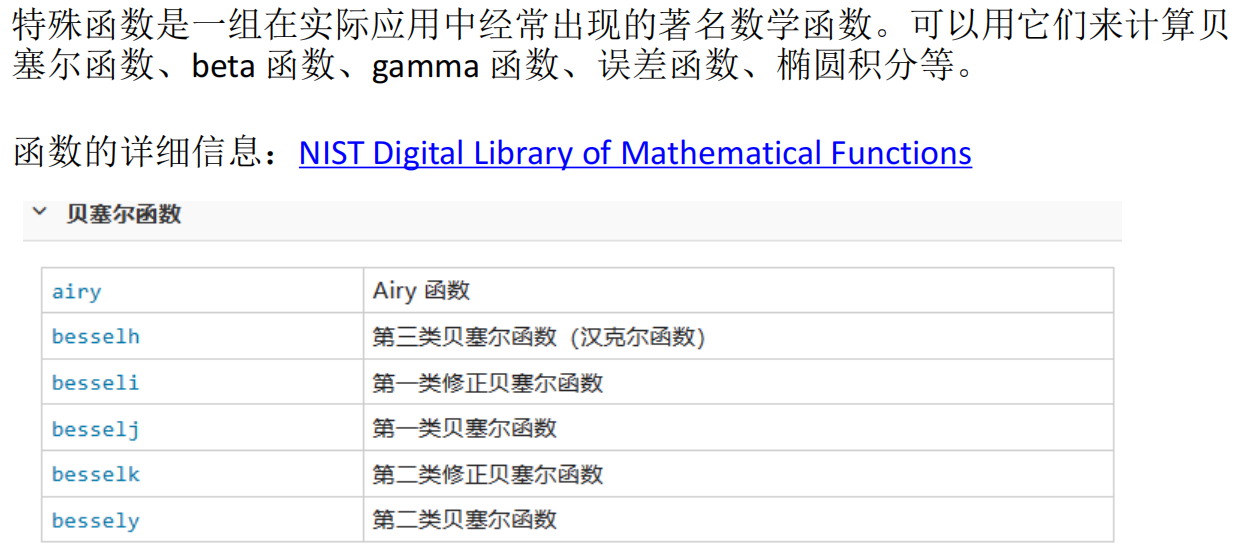
2.4 特殊函数
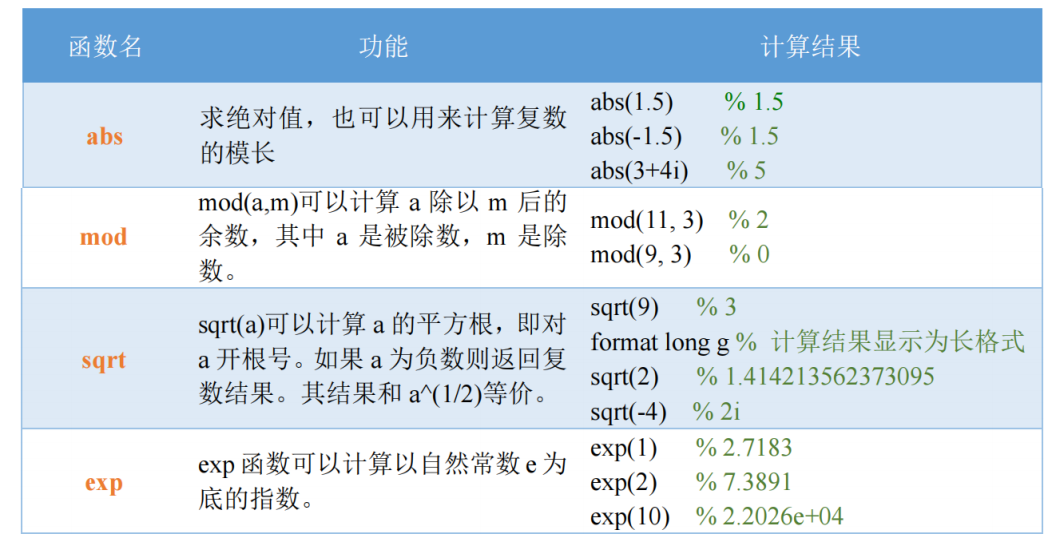
2.5 常用函数
format long
sqrt(1:9);
format long g 长格式
% format short 默认格式
sqrt(1:9);
format long vs format long g
- 固定位数 vs. 自动选择:
format long总是显示15位数字,而format long g会根据数值大小自动选择最合适的显示方式。 - 科学记数法:
format long g更倾向于在数值非常大或非常小的时候使用科学记数法,而format long则尽可能显示完整的数字。
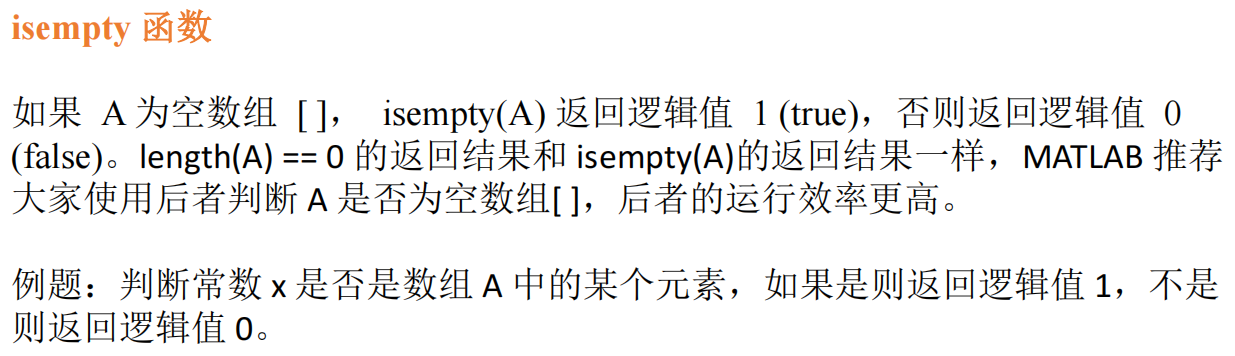
A = [1:9];
x = 5;
A == x;
~isempty(find(A == x));
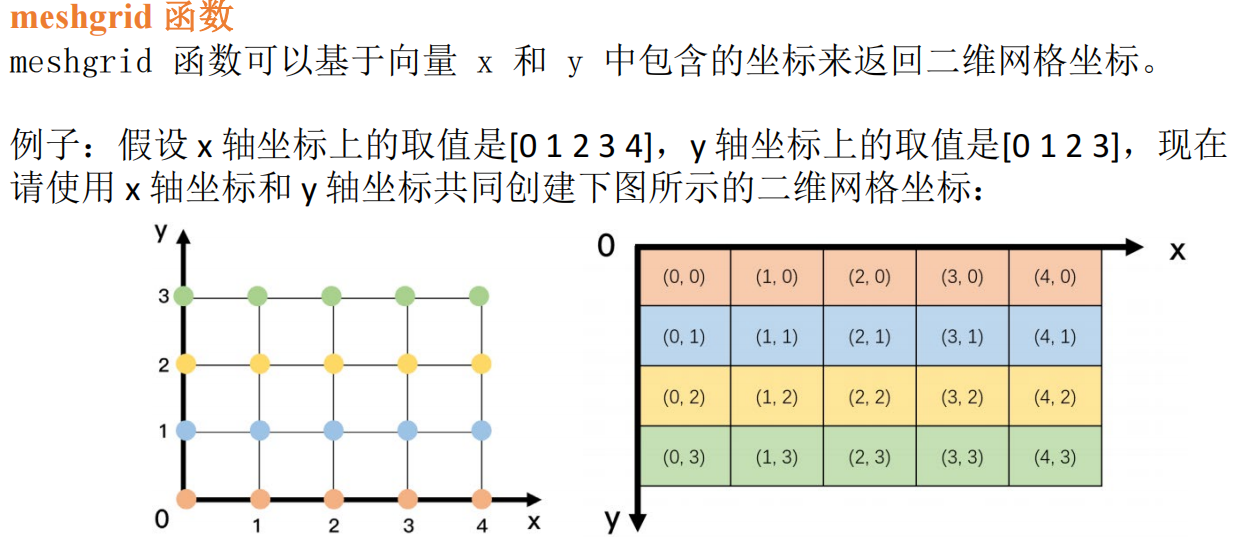
x = 0:4;
y = 0:3;
[xx,yy] = meshgrid(x,y);
xx;
yy;
z = xx.^2+yy.^2 % f(x,y) = x^2+y^2
seed = 3;
rng(seed);
randi(10,3,3)
3 matlab二维绘图、三维绘图及句柄
3.1 二维图形绘制
基本绘图函数
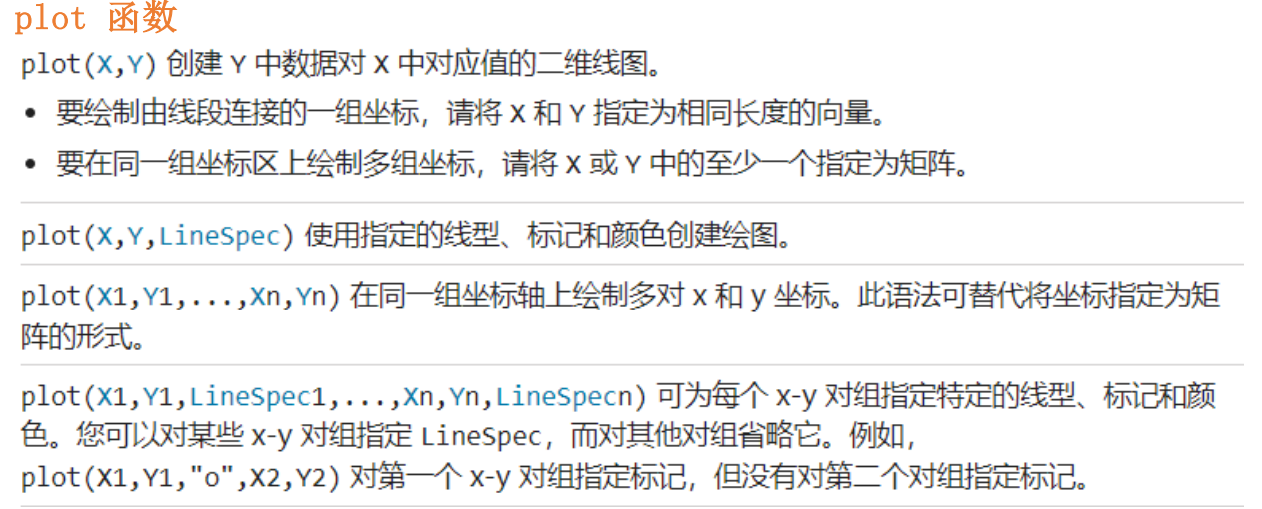
% plot(x,y)
x = [1:9];
y = [2:10];
plot(x, y);

% plot(x)
x = 1:10;
y = x.^2;
plot(y); % 默认横坐标是1,2,3,... 纵坐标是

% 虚数
x = [1:9];
y = [0.1:0.2:1.7];
X = x+y*i
plot(X);

% plot(x,y) 当x和y为矩阵时
t = 0:0.01:2*pi;
t = t.'; % 行向量变列向量
x = [t,t,t];
y = [sin(t),sin(2*t),sin(0.5*t)];
plot(x,y);

% 绘制多条曲线 plot(x1,y1,...,xn,yn)
x1 = linspace(0,2*pi,10);
x2 = linspace(0,2*pi,20);
x3 = linspace(0,2*pi,200);
y1 = sin(x1);
y2 = sin(x2)+2;
y3 = sin(x3)+4;
plot(x1,y1,x2,y2,x3,y3);
plot(x1,y1,':g',x2,y2,x3,y3); % x1 y1是虚线 绿色
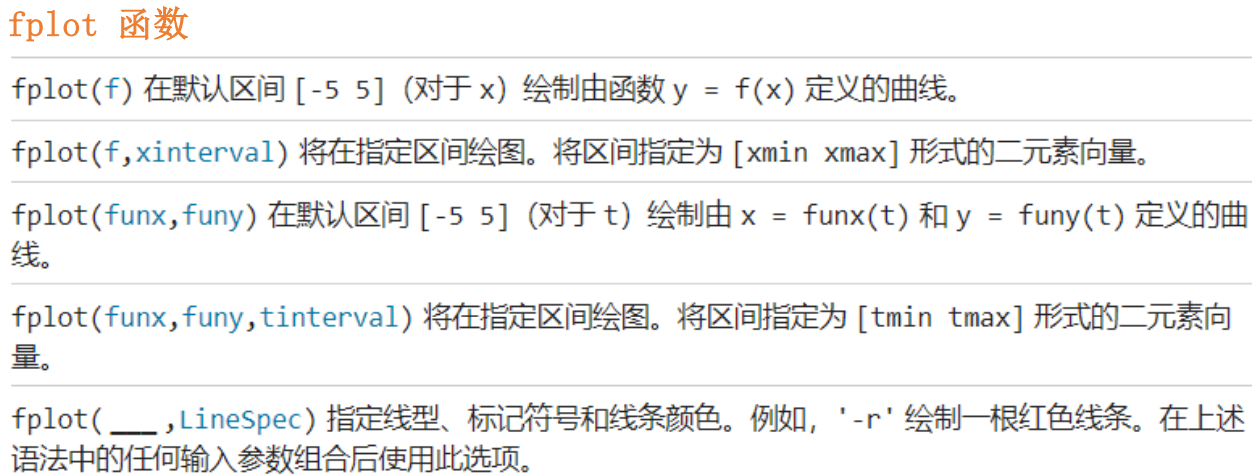
% fplot(f, xinterval)
fplot(@(x)sin(1./x),[0,0.2]);

% fplot(funx, funcy, tinterval, LineSpec)
fplot(@(t)t.*sin(t),@(t)t.*cos(t),[0,10*pi],'-r');
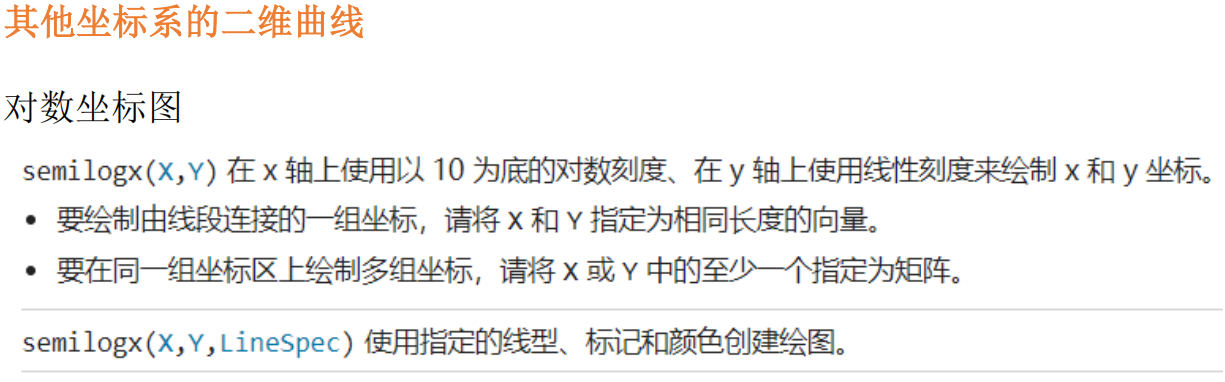
x = logspace(-1,2);
y = x;
semilogx(x,y);
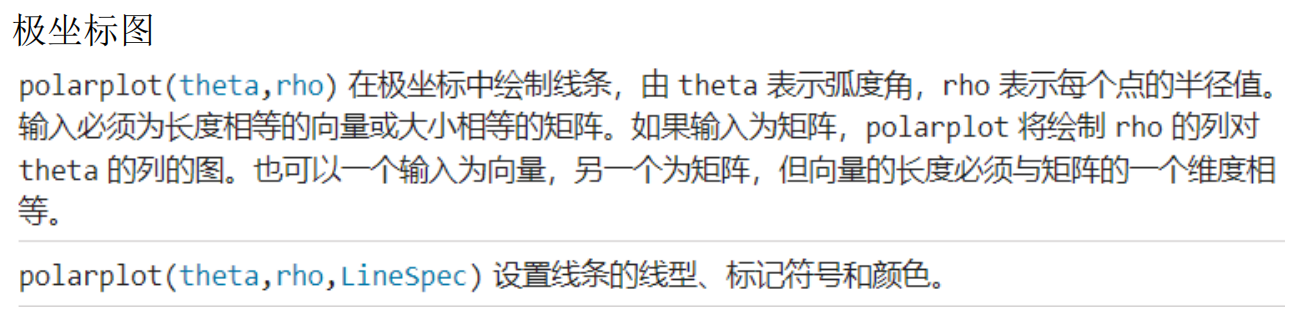
theta = 0:0.01:2*pi;
rho = sin(theta) .* cos(theta);
polarplot(theta,rho);
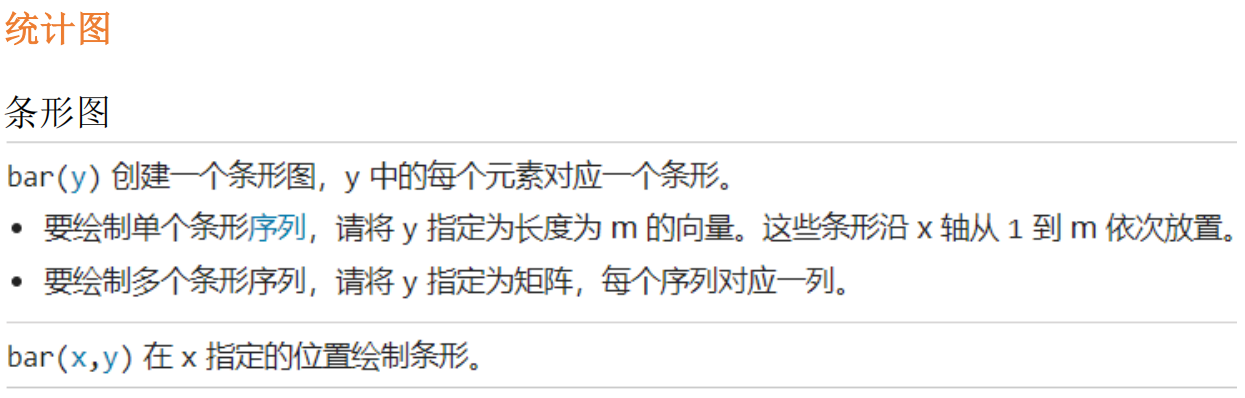
x = [2021,2022,2023];
y = [10,20;20,30;100,200];
bar(x,y);
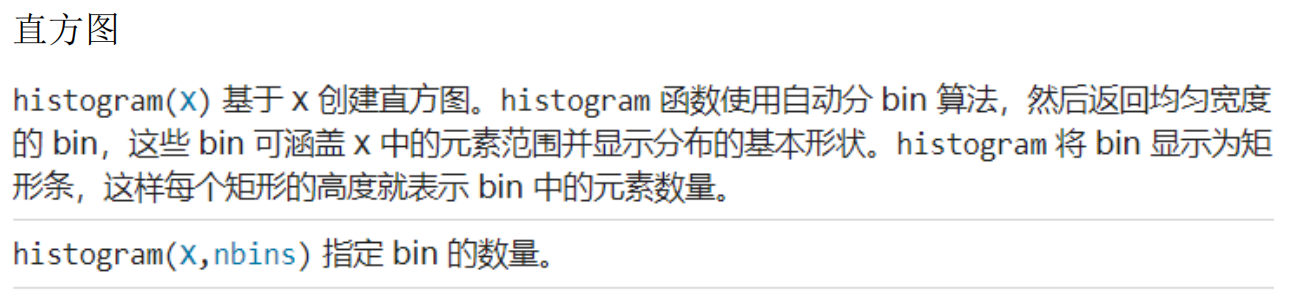
x = randn(1000,1);
nbins = 25;
h = histogram(x,nbins);
counts = h.Values;
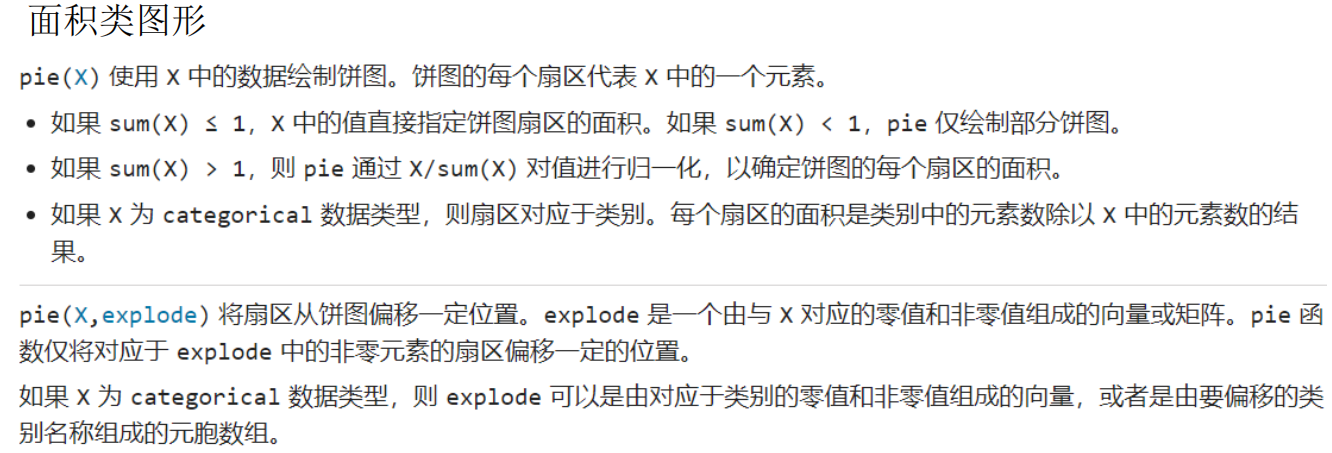
x = 1:2:9
pie(x)
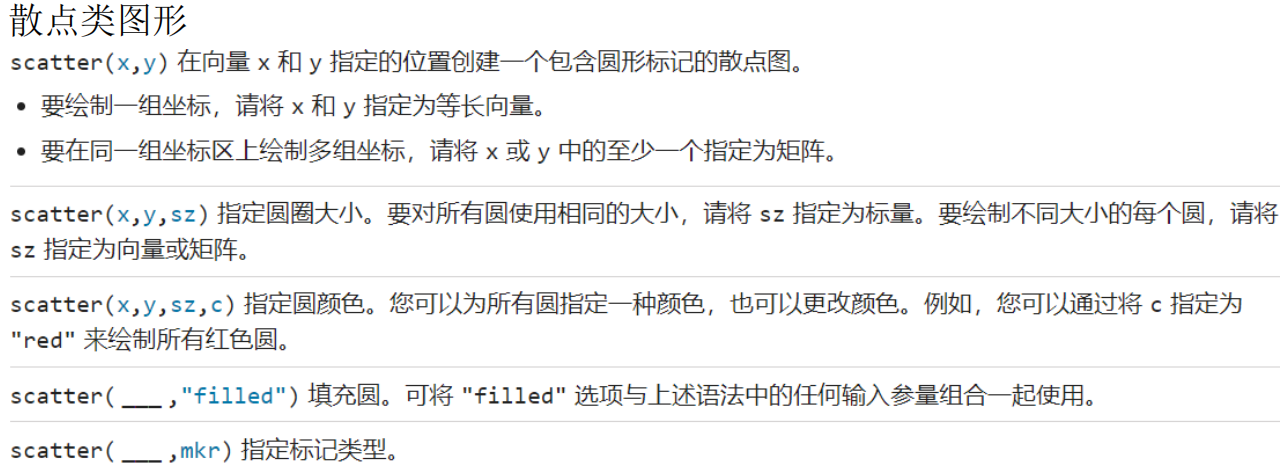
t = 0:pi/50:2*pi;
x = 16*sin(t).^3;
y = 13*cos(t) - 5*cos(2*t) - 2*cos(3*t) - cos(4*t);
scatter(x,y,'red',"filled")
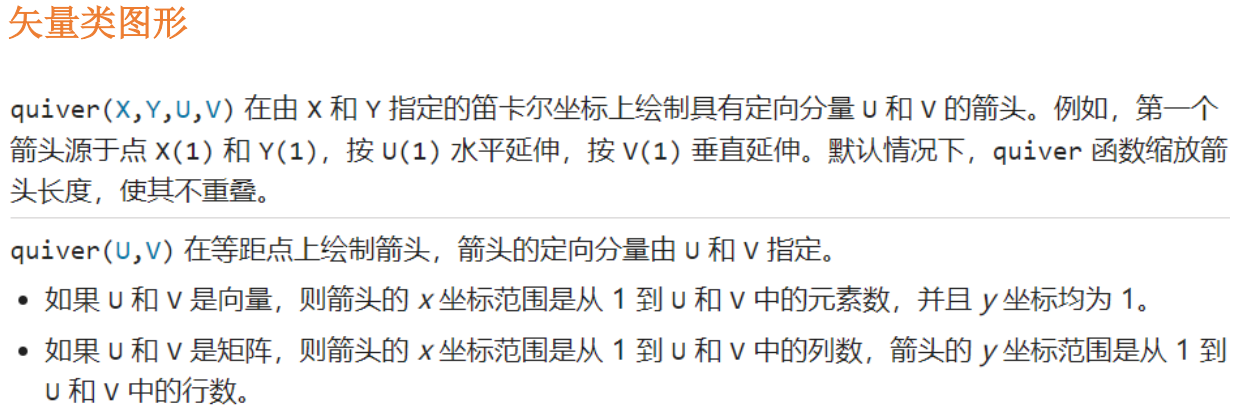
A = [4,5];
quiver(0,0,A(1),A(2));
图形属性设置
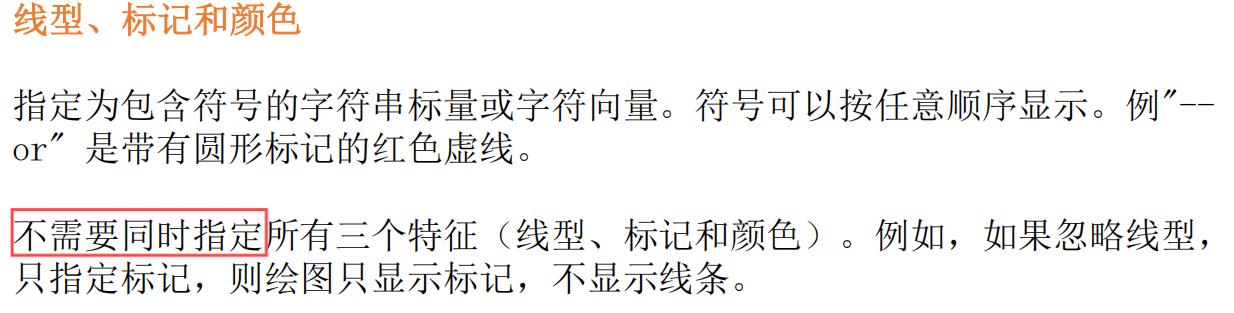
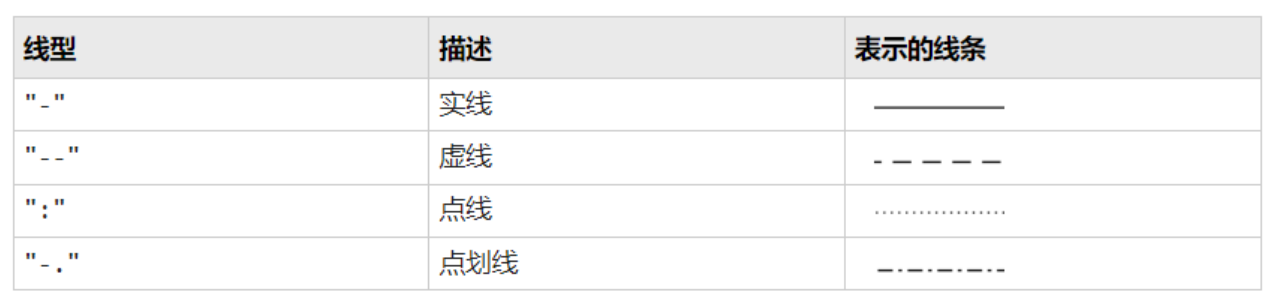
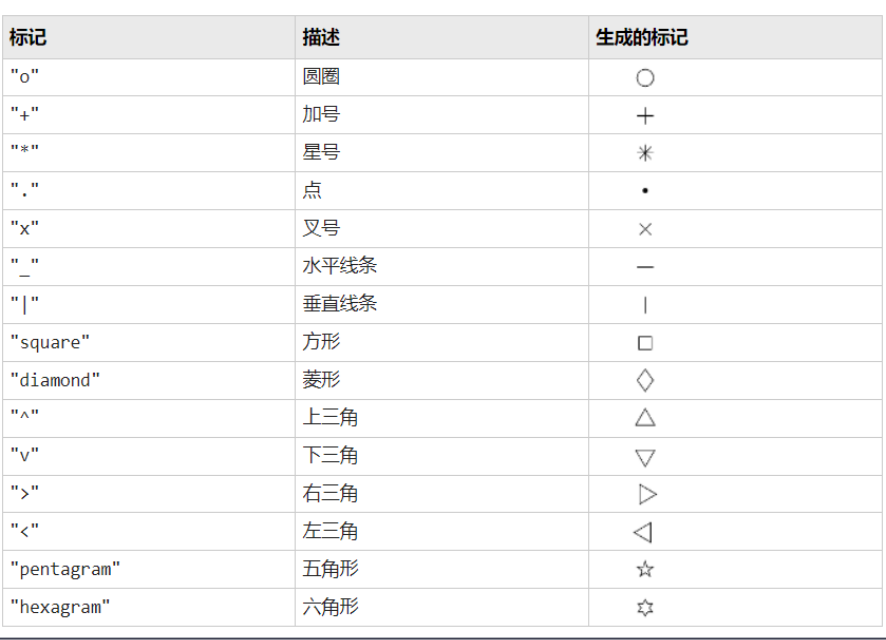
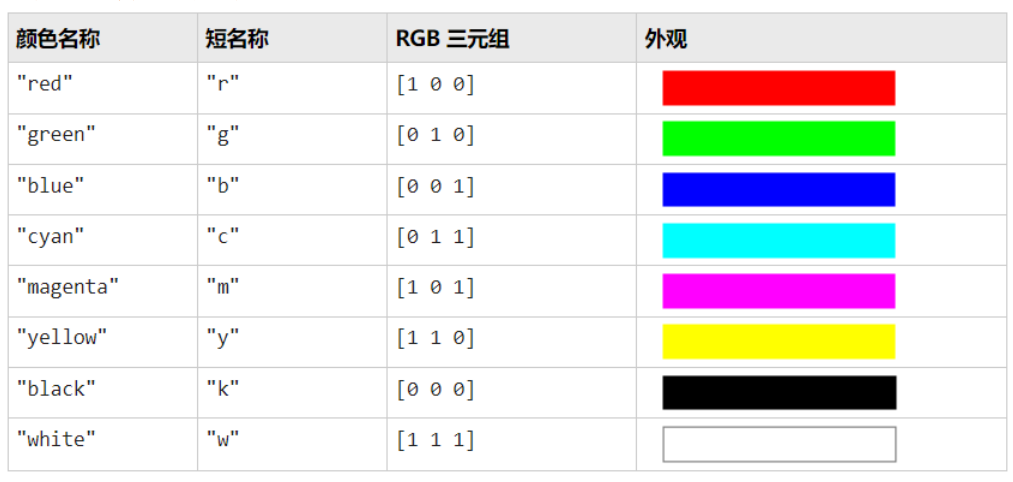
线型、标记和颜色
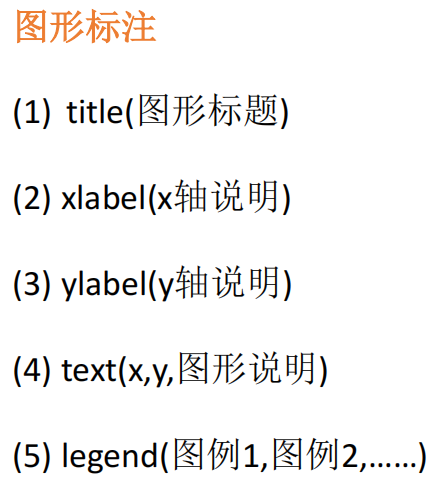
图形标注
坐标控制
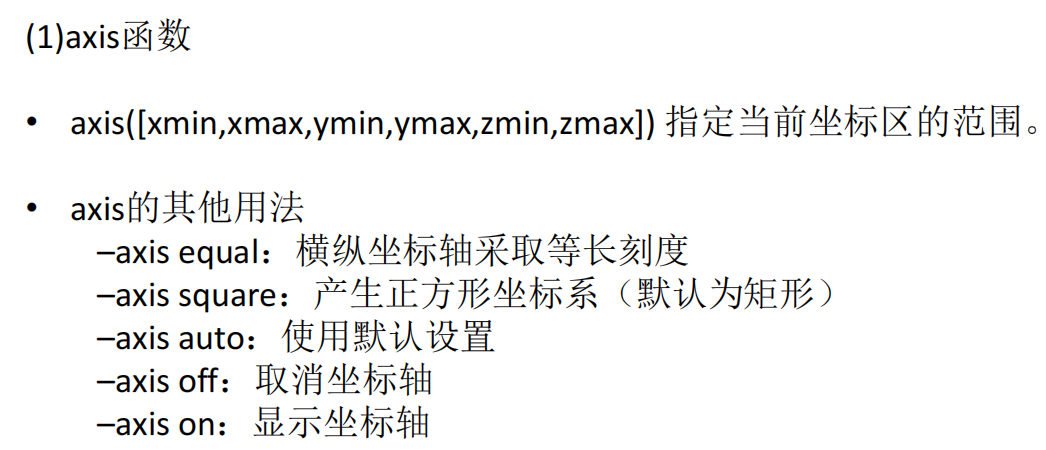
x = linspace(0,2*pi,200);
y = [sin(x);sin(2*x);sin(0.5*x)];
plot(x,y);
axis([0,6.5,-1.5,1.5]);
title('三个正弦函数曲线y=sin{\theta}','FontSize',24);
xlabel('X');
ylabel('Y');
text(2.5,sin(2.5),'sin(x)');
text(2.5,sin(2*2.5),'sin(2x)');
legend('sin(x)','sin(2x)','sin(0.5x)');
图形保持
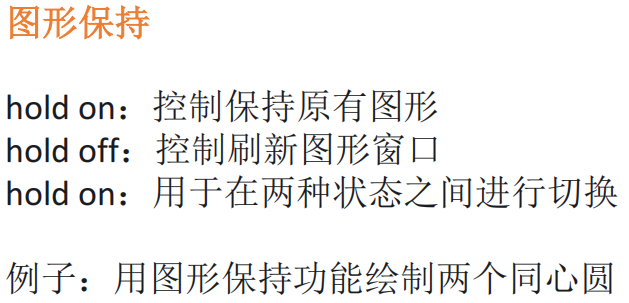
t = linspace(0,2*pi,200);
x = sin(t);
y = cos(t);
plot(x,y,'b');
axis equal
hold on
x1 = 2*sin(t);
y2 = 2*cos(t);
plot(x1,y2,'r');
3.2 三维图形绘制
三维曲线
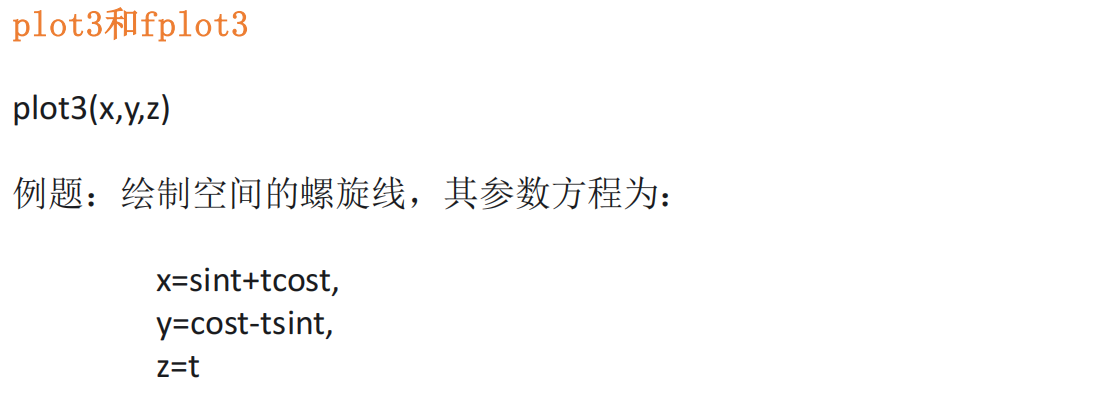
t = [0:0.1:10*pi];
x = sin(t) + t.*cos(t);
y = cos(t) - t.*sin(t);
z = t;
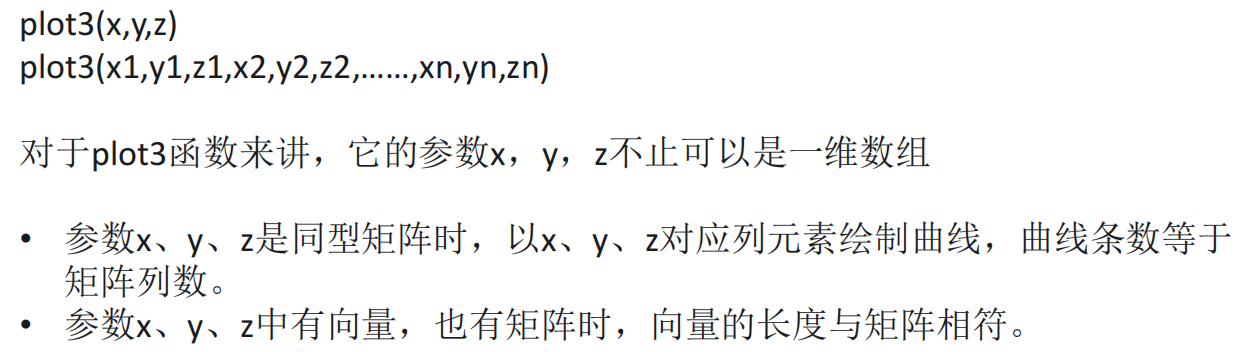
plot3(x,y,z);
y = t;
plot3(t,y,sin(t));
% 有矩阵 n行3列
t = t.';
x = [t,t,t];
y = [sin(t),sin(t)+2,sin(t)+4];
z = t;
plot3(x,y,z);
% 有矩阵 3行n列
x = t;
y = [sin(t);sin(t)+2;sin(t)+4];
z = t;
plot3(x,y,z);
% 多个参数
plot3(x,sin(t),z,x,sin(t)+2,z,x,sin(t)+4,z);
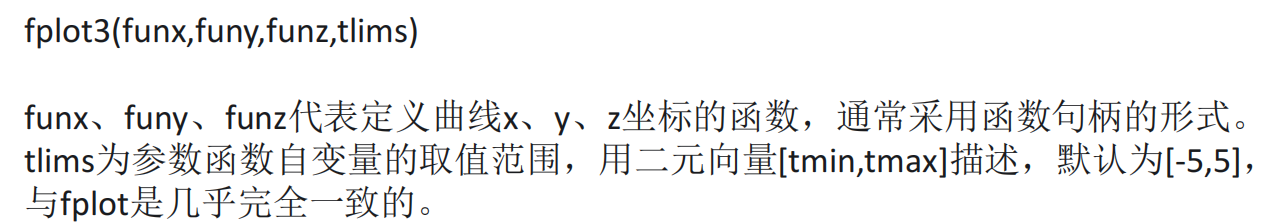
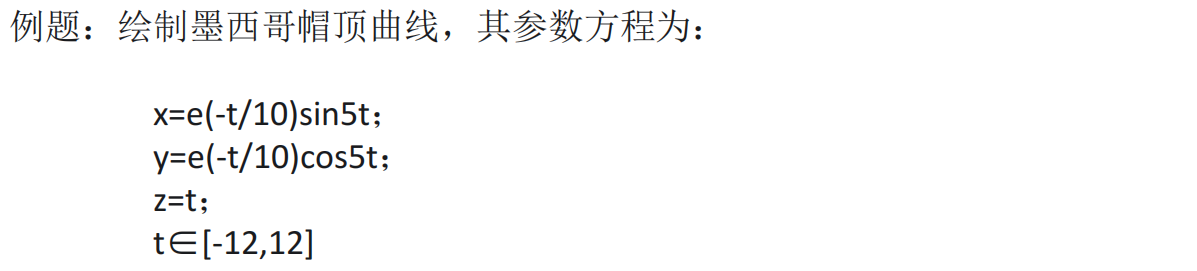
x = @(t) exp(-t/10).*sin(5*t);
y = @(t) exp(-t/10).*cos(5*t);
z = @(t) t;
fplot3(x,y,z,[-12,12],'-r');
三维曲面
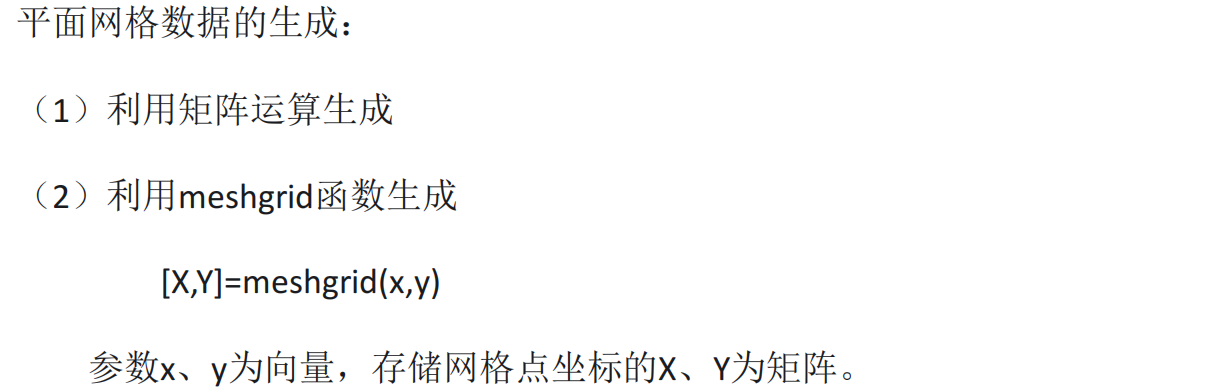
x = [2:6];
y = [3:8]';
% X = ones(size(y))*x;
% Y = y*ones(size(x));
[X,Y] = meshgrid(x,y);
X;
Y;
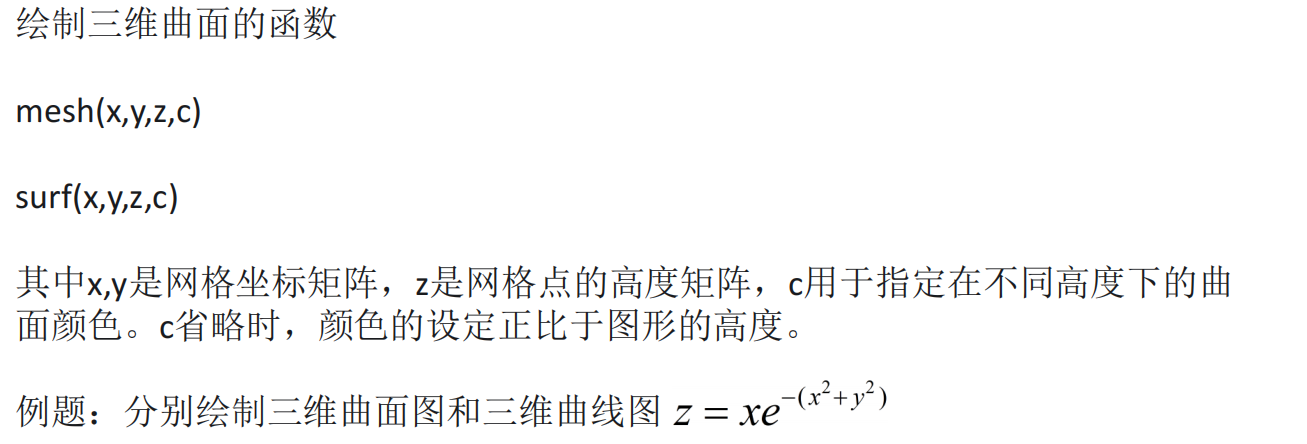
x = -1:0.2:2;
[X,Y] = meshgrid(x);
Z = X.*exp(-X.^2-Y.^2);
plot3(X,Y,Z);
mesh(X,Y,Z);
surf(X,Y,Z);

x = [2:6];
y = [3:8]';
[X,Y] = meshgrid(x,y);
Z = randn(size(X));
plot3(X,Y,Z);
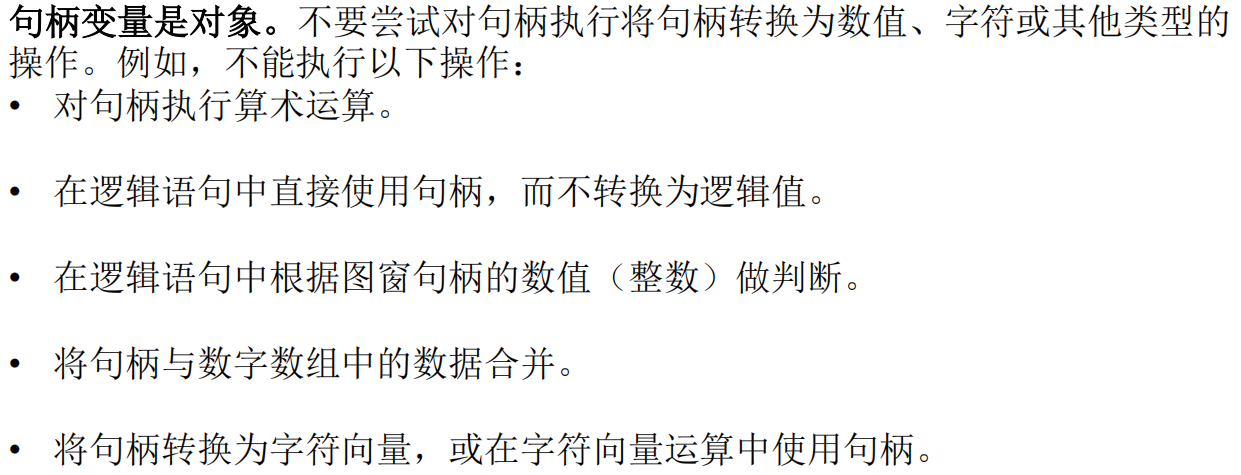
3.3 句柄/窗口控制
3.3.1 图形对象句柄及属性
句柄相当于引用

x = 1:10;
y = x.^2;
h = plot(x,y);
h1 = text(5,25,'说明');
h1.FontSize = 24;

x = linspace(0,2*pi,100);
y = sin(x);
h = plot(x,y);
get(h)
set(h,'Color','red')
3.3.2 图形属性设置
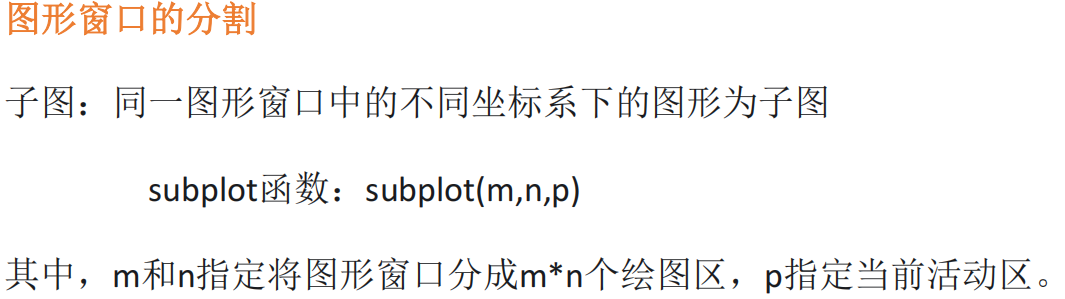
x = linspace(0,2*pi,100);
subplot(2,2,1);
plot(x,sin(x));
title('sin(x)');

subplot(2,2,2);
plot(x,cos(x));
title('cos(x)');

subplot(2,2,3);
plot(x,tan(x));
title('tan(x)');

subplot(2,2,4);
plot(x,cot(x));
title('cot(x)');

x = -1:0.2:2;
[X,Y] = meshgrid(x);
Z = X.*exp(-X.^2-Y.^2);
subplot(1,3,1);
plot3(X,Y,Z);

subplot(1,3,2);
mesh(X,Y,Z);

subplot(1,3,3);
surf(X,Y,Z);
